HelixIQ²Intelligence, Amplified.
Clinical Trial Site Selection & Optimization Accelerator
Site activation averages 8+ months. 70% of trials are delayed — over half trace back to activation problems. The HelixIQ² Command Center diagnoses stalled sites, models cascade impact across all four workstreams (Regulatory, Legal, Logistics, Training), and orchestrates resolutions — all through conversation. No training. No IT tickets. No batch runs.
Study Start-Up Is the Critical Bottleneck in Drug Development.
The Cost of Inaction
Clinical trial site activation averages 8+ months — 9.4 months at academic medical centers. 70% of trials experience delays, and over half trace back to site activation problems. Every day a site sits unactivated costs sponsors $600K to $8M in lost revenue — per site, per day.
CTA negotiations average 90+ days, up from 60 days just a few years ago. 94% of CTA time is "white space" — the document sitting idle between review cycles. SSU Managers juggle 10-30 sites across spreadsheets, CTMS systems, and endless email threads with no unified view.
What HelixIQ² Delivers
An AI-driven orchestration engine that diagnoses root causes, surfaces cascade impact across all four workstreams — Regulatory (IRB, 1572, ICF), Legal (CTA, budgets, indemnification), Logistics (IP shipments, lab kits, system access), Training (GCP, protocol, EDC) — and orchestrates resolutions through conversation.
Not a dashboard. Not a CTMS. A command center that knows why sites are stalled and what to do about it. Pipeline KPIs with cost of delay. Automated root cause diagnosis. Conversational what-if modeling. Human-in-the-loop approvals.
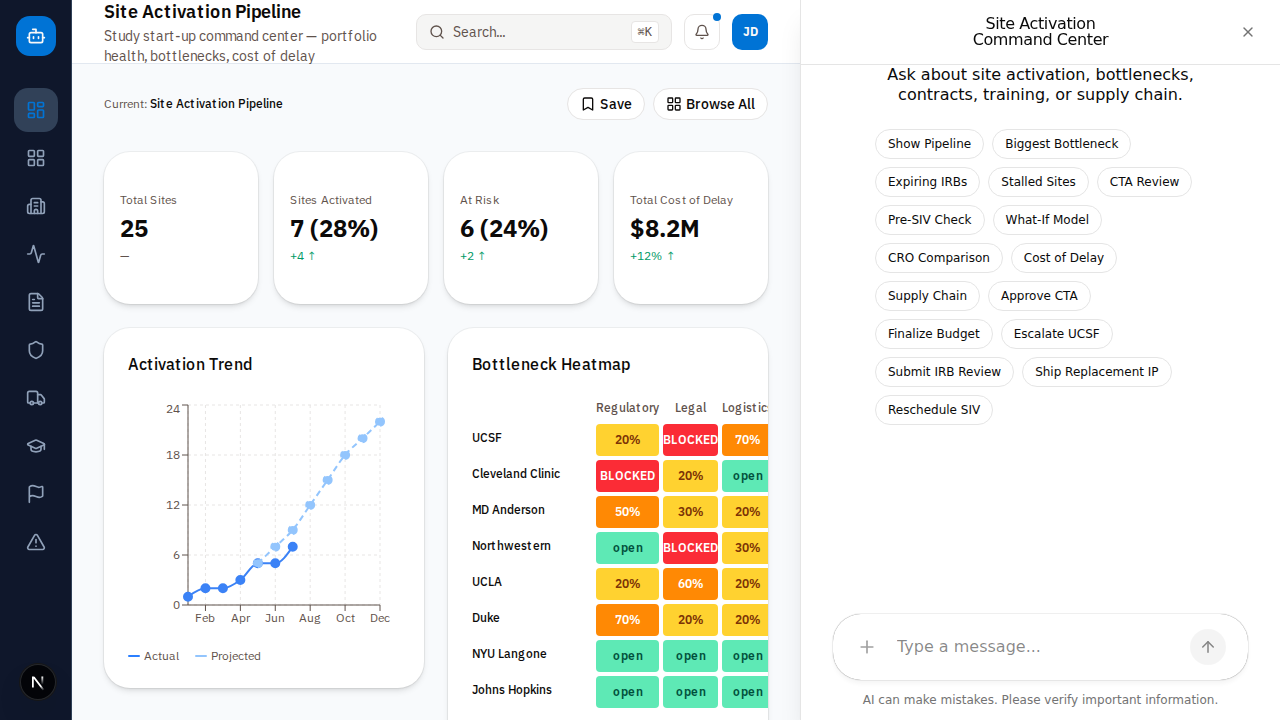
Ask Questions. Get Visual Answers. Take Action.
No training. No IT tickets. No batch runs. Ask questions in plain English and get visual answers — charts, diagnostic cards, site profiles, and one-click approval workflows.
“Show me the activation pipeline across all trials”
“Which sites are stalled and what’s blocking each one?”
“Approve the CTA for Johns Hopkins — show me the budget context first”
Find. Diagnose. Act. In One Conversation.
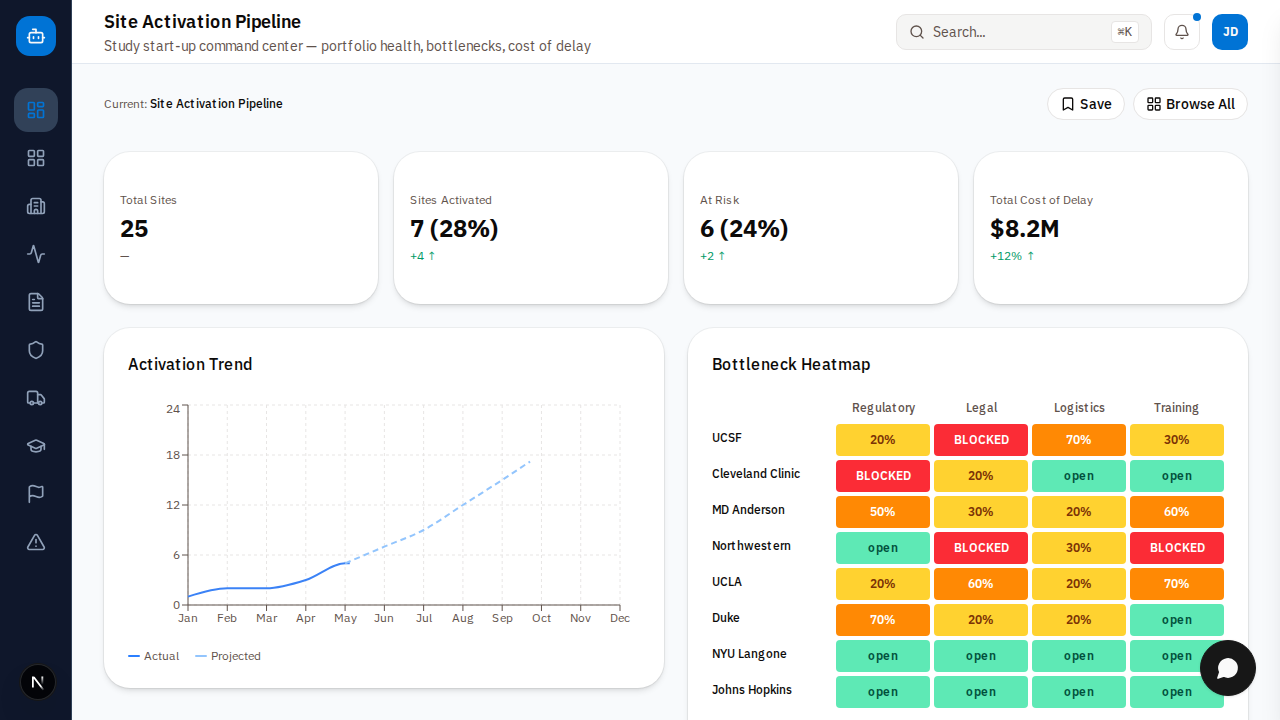
01 / MONITOR
Activation Pipeline Dashboard
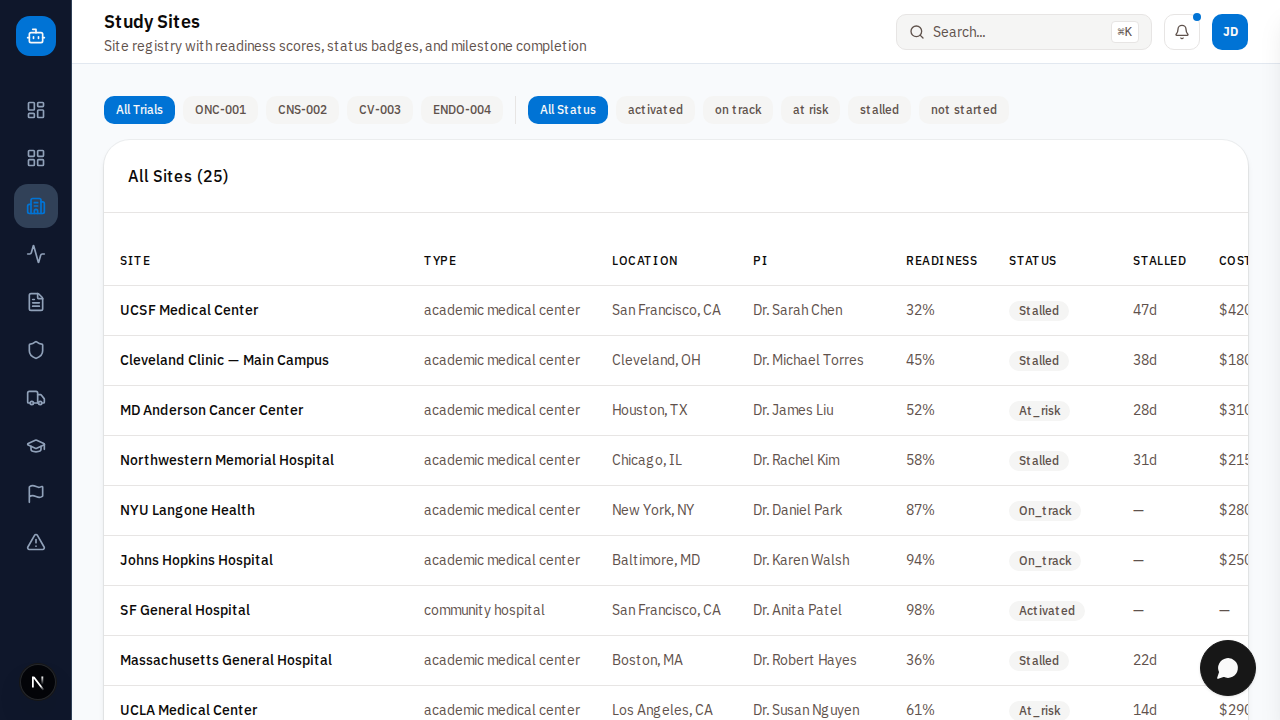
Real-time pipeline KPIs — activated, on-track, at-risk, stalled — with total cost of delay computed across the portfolio. Bottleneck heatmap identifies which workstreams are blocked per site. Activation trend charts project future activations based on current pipeline velocity. Site readiness comparison across institutions, CROs, and therapeutic areas.
02 / DIAGNOSE
Root Cause Diagnosis, Automated
Every stalled site gets a structured diagnosis: primary cause with confidence level, contributing factors ranked by impact, cascade impact across all four workstreams, and specific remediation recommendations with cost-benefit estimates. The system doesn't just flag problems — it explains why they happened and what to do next.
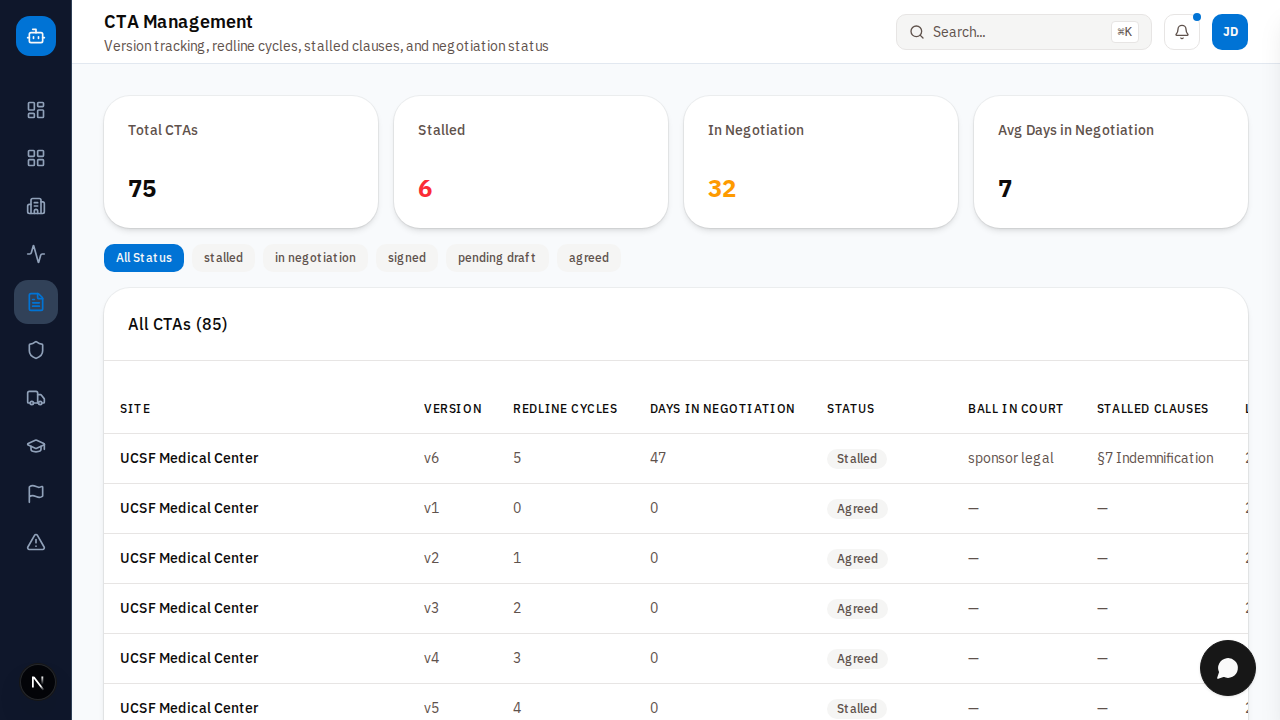
03 / ANALYZE
Contract & Budget Intelligence
CTAs managed at the clause level — version history, redline cycles, ball-in-court status, and stalled clause identification. Auto-escalation when white space exceeds configurable thresholds. Portfolio-wide pattern recognition spots systemic issues across sites. Per-patient cost modeling with budget-to-actual variance tracking built in.
04 / TRACK
Regulatory & Supply Chain
IRB submission tracking with central vs. local timelines (27 days vs. 66 days) and expiration risk scoring weighted by enrolled patient counts. Essential documents per ICH E6(R3) with TMF mapping. IP shipments with temperature chain monitoring and excursion alerts. Lab kit management with reorder triggers based on enrollment velocity.
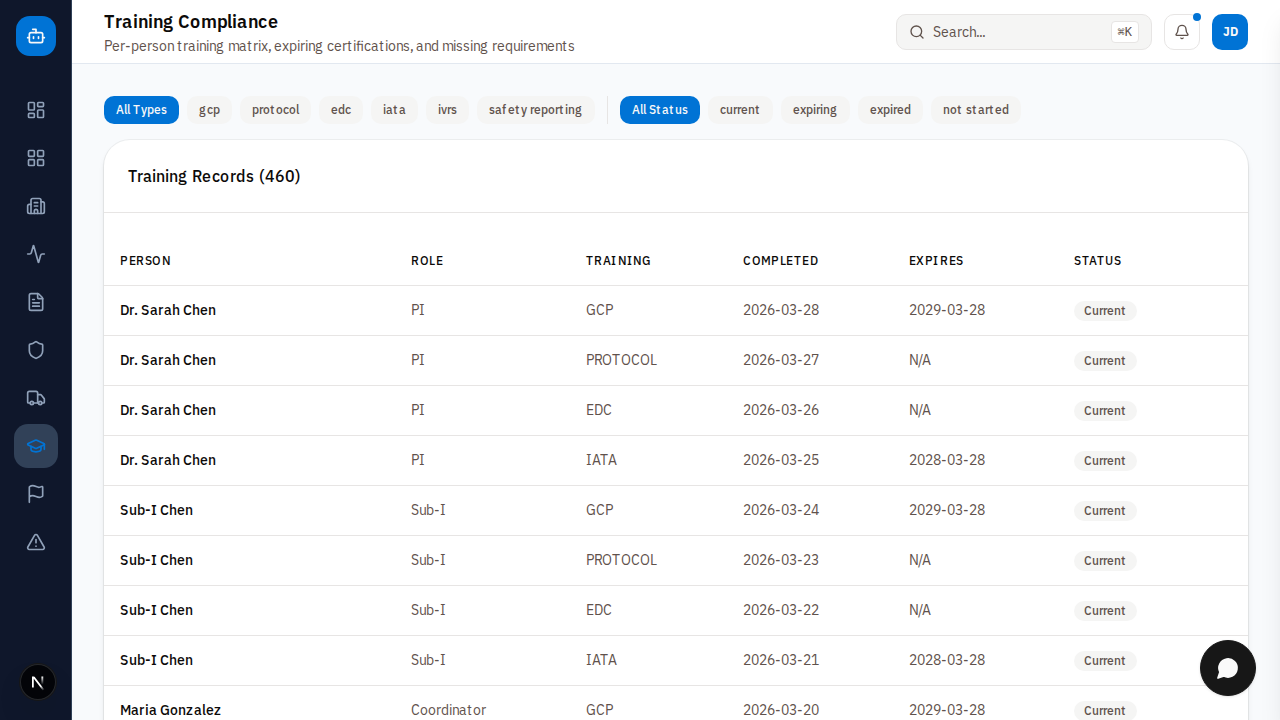
05 / TRAIN
Training & Milestones
Every site's 5-8 personnel tracked per certification — GCP, IATA, protocol-specific, EDC, safety reporting — with proactive expiration alerts 90 days out. Pre-SIV Gatekeeper checks training compliance, document completeness, and system access before every Site Initiation Visit. 49 milestone types across 4 tracks with dependency visualization.
06 / MANAGE
Issue Management & Escalation
10 failure modes with structured root cause taxonomy — CTA Clause Deadlock, IRB Queue Wait, Budget Disagreement, Document Churn, Site Staffing, IP Supply Gap, and more. Severity-weighted escalation from auto-escalate to VP to logged-and-tracked. Re-escalation for issues open 14+ days without activity.
07 / APPROVE
HITL Command Center
100% of approvals happen in chat. Every action: the system researches context, surfaces financial impact, recommends action, then pauses for human confirmation. Full audit trail with timestamp and user identity on every action. CTA sign-off, budget finalization, IRB continuing review, emergency IP reshipment, and executive escalation — all in conversation.
Built Different. Built for Activation Speed.
Chat-First Interface
Conversation is the primary UI. Dashboards, diagnostic cards, and approval workflows render in response to natural language — no training, no IT tickets, no batch runs.
Live Results
Analysis, diagnostic cards, and what-if scenarios appear in the conversation as they complete. No batch runs. No waiting for end-of-day reports. Answers arrive at the speed of the business.
Cross-Workstream Intelligence
Simultaneously analyzes Regulatory, Legal, Logistics, and Training workstreams. When a CTA stalls, the system surfaces the cascade impact — which milestones are blocked, what it costs per day, and what to do next.
HITL by Design
Every action requires explicit human approval. The system recommends — humans decide. Full audit trail with timestamp and user identity on every action. Auditor-ready at all times.
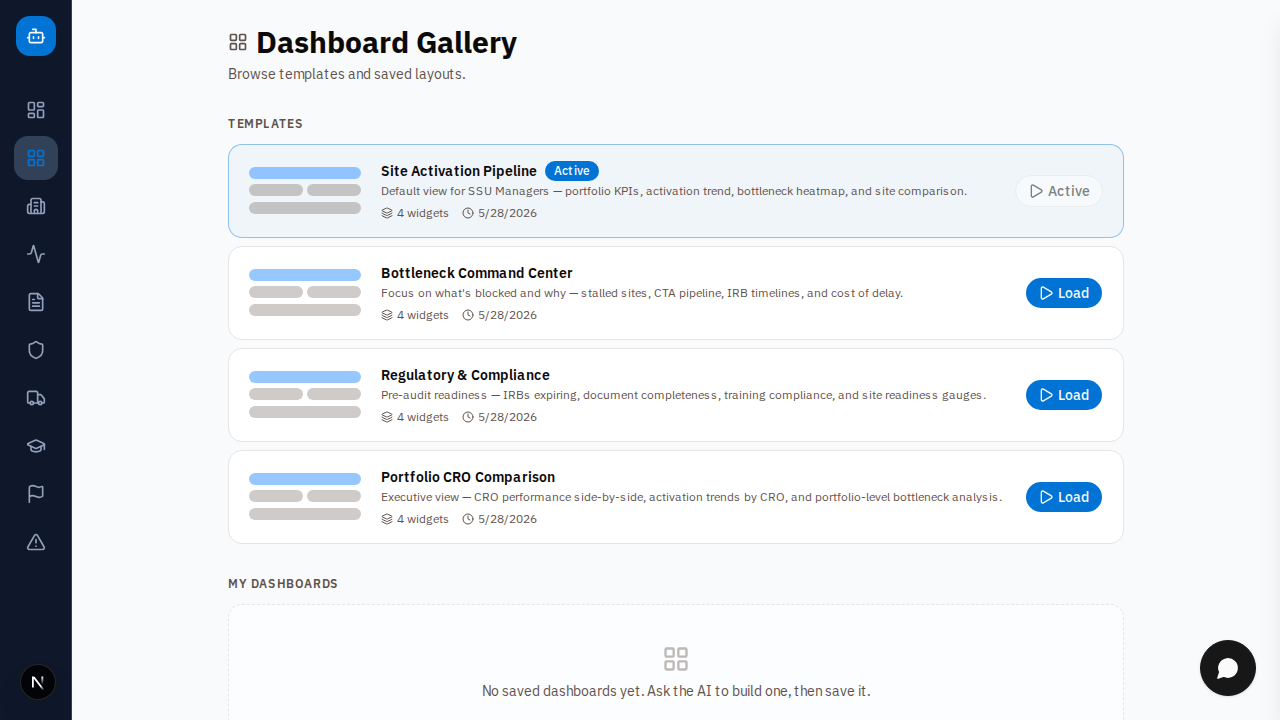
Pre-Built Dashboard Templates
Ready to accelerate your site activation?
Pipeline visibility. Root cause diagnosis. One conversation.